

In the first half of 2026 (H1), global energy storage cell shipments reached 467.84 GWh, up 94.8% year-on-year. Quarterly shipments exceeded 200 GWh for the third consecutive quarter, with second-quarter shipments reaching a record 262 GWh. Shipments to markets outside China totaled nearly 250 GWh in H1, accounting for more than half of the global total.
The headline figures hide structural shifts. Three developments have occurred during H1, including a reshuffling of the competitive landscape, a new normal marked by a persistently tight supply-demand balance amid the rapid iteration of cell formats, and a rebound in the share of shipments to markets outside China to above 50%. InfoLink Consulting examines each of these shifts in turn.
Concentration falls as competition intensifies
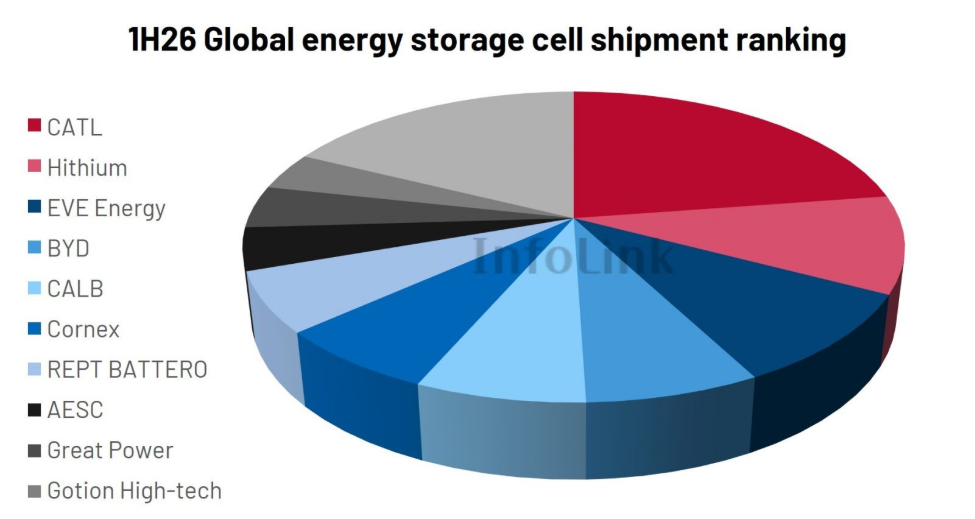
The ten largest suppliers’ combined share of global energy storage cell shipments (CR10) has fallen steadily over the past year, from 91.2% in H1 2025 to 88.8% for full-year 2025, 85.2% in the first quarter of 2026 (Q1), and 82.3% in H1 2026. The nearly 9-percentage-point year-on-year decline marks the sharpest drop in recent years.
The decline is more due to the dynamics of a supply-constrained market than any seasonal variations. Once capacity at leading manufacturers is fully committed, incremental demand spills over to mid-tier suppliers. Once these suppliers pass customer qualification and establish a delivery track record, the market share they gain will not automatically revert to the market leaders.
CATL, Hithium, EVE Energy, BYD Energy Storage, and CALB retained the top five positions, although their combined share (CR5) fell to 56.5%. Meanwhile, emerging players such as Sunwoda and Ganfeng LiEnergy are also gaining ground, with several challengers now ranked 11th to 15th and making a strong push into the top 10. The competitive landscape is becoming less concentrated at the top as mid-tier manufacturers accelerate their expansion.
However, as large-capacity cells enter mass production, leading manufacturers could see their market share return to an upward trajectory, supported by consistent product quality, economies of scale, and stronger pricing advantages across their sales channels.

*Source: InfoLink’s Global Energy Storage Supply Chain Database
A tight supply-demand balance becomes the norm as cell formats evolve rapidly
The 314 Ah cell has remained in tight supply for nearly a year, with prices rising by more than 15% over the past six months. Meanwhile, the penetration rate of 500 Ah and larger cells in the utility-scale storage market exceeded 10% in H1 2026.
The 500-Ah-and-above segment now features multiple competing formats, including 587 Ah, 588 Ah, 648 Ah, 684 Ah, and 702 Ah, and even cells exceeding 1,000 Ah. For cell manufacturers, choosing a format that fails to gain market adoption can prove far more costly than waiting to see which format becomes the industry standard.
The solar PV industry has seen a similar pattern before. The rapid evolution of energy storage cell formats closely resembles the rivalry between 182 mm and 210 mm that emerged after a period of rapid changes in PV wafer sizes. There is no clear technical winner. Instead, the cost of adapting the broader supply chain determines how quickly the market converges on a standard. Until then, established cell formats will still retain a high market share in the near term.
At this stage, 587 Ah and 588 Ah energy storage cells remain the main focus of capacity expansion, although manufacturers are still proceeding cautiously amid widespread wait-and-see sentiment. Progress on production lines for formats such as 648 Ah warrants close attention. In residential storage, meanwhile, the market is rapidly shifting from 100 Ah to 314 Ah cells, with the combined penetration rate of 280 Ah and 314 Ah cells approaching 30%. In H2, the adoption of 392 Ah cells in the residential storage market will be worth watching, as some manufacturers push the transition from 314 Ah to 392 Ah cells.
Based on H1 shipment data, book-to-bill (B/B) ratios that have remained above 1.2 for several consecutive months at a number of manufacturers, and continued export front-loading ahead of Q4, InfoLink expects the tight supply-demand balance to persist through H2, with new capacity unlikely to ramp up quickly enough to offset demand pulled forward by policy.
Accordingly, InfoLink has raised its forecast for global energy storage cell shipments in 2026 to 1,026 GWh, marking the second upward revision this year. Compared with shipments of 612.39 GWh in 2025, the new forecast represents growth of around 67.5% year on year.
With 467.84 GWh already shipped in H1, the revised forecast leaves around 558 GWh for H2. With manufacturers operating at full capacity and selling all their output, and B/B ratios remaining elevated, InfoLink considers this a relatively conservative trajectory. The forecast rests on three assumptions: ramp-up losses as production lines transition to large-capacity cell production, a seasonal decline in global demand in Q4, and an export rush toward year end that is expected to show up primarily in customs clearance volumes rather than additional production.
Emerging markets gain momentum: share of shipments to markets outside China tops 50%
Energy storage cell shipments to markets outside China reached 248.73 GWh in H1, accounting for around 53.2% of global shipments.
Changes to China’s export tax rebates were a key factor shaping shipments during the period. Readers in the PV industry will already be familiar with the first part of the policy announced by China’s Ministry of Finance and State Taxation Administration on Jan. 9: export tax rebates for PV products were eliminated from April 1, 2026. Energy storage batteries, however, followed a more gradual phaseout schedule. The rebate rate was reduced from 9% to 6% from April 1 through Dec. 31, 2026, before being eliminated entirely on Jan. 1, 2027.
The different timelines have produced very different patterns. PV manufacturers rushed to export in Q1 before the rebate was eliminated, and the rush largely ran its course within the quarter. For energy storage batteries, the phaseout stretches across the year. Suppliers accelerated shipments in Q1 ahead of the reduction from 9% to 6%, but a 6% rebate remained in place from April onward, with full elimination taking effect on Jan. 1, 2027. This explains why the cell market saw no seasonal slowdown in H1.
The U.S., however, has not been the main source of this latest growth. Quite the opposite: import restrictions tightened further in H1. The Section 301 tariff increase took effect during the period, raising the tariff rate applicable to Chinese-made battery energy storage system (BESS) products from 7.5% to 25%. Combined with other duties, the overall tariff rate climbed as high as 48.4% at one point and currently stands at around 40.9%. Tariff and non-tariff barriers operate in tandem, with measures such as Federal Communications Commission (FCC) requirements and foreign entity of concern (FEOC) restrictions imposing greater practical constraints on the industry than tariffs themselves.
The resulting supply gap in the U.S. is being filled by South Korean manufacturers. LG Energy Solution (LGES) has begun mass production of lithium iron phosphate (LFP) cells for energy storage at its facility in Holland, Michigan, and plans to expand capacity from 17 GWh to 30 GWh in 2026. The shift is also visible in the rankings. LGES ranked tenth in utility-scale storage cell shipments and eighth in shipments to markets outside China, with its market share rising quarter by quarter since Q2 2025. This is broadly in line with InfoLink’s Q1 expectation that South Korean manufacturers would return to the global top 10.
Beyond the U.S., the rising share of shipments to markets outside China is being driven primarily by Europe’s storage deployment targets and policy support, growth in both utility-scale and distributed storage in Australia, large-scale projects across Latin America and the Middle East, and emerging markets such as India, Brazil, and Southeast Asia that are moving from initial market formation into a more meaningful phase of deployment.
Viewed through the lens of the PV industry’s development, each of these three shifts has a familiar precedent. Concentration in the midstream supply chain eased during periods of rapid capacity expansion. Product formats evolved quickly along multiple tracks before standards began to converge. Demand was also clearly front-loaded around policy step-downs.
The difference is speed. It took the PV industry nearly a decade to move through these stages. Energy storage appears to be compressing a similar transition into just one or two years. That suggests many of the lessons learned from the PV industry remain relevant to energy storage, but the window for responding to market shifts has become much shorter. The first real test of whether those lessons still hold will come in 2027.
Corrine Lin brings over a decade of expertise in renewable-energy research and market intelligence, spanning solar PV, energy storage, and the net-zero transition. As InfoLink’s Chief Analyst since its founding, she has led the team in delivering actionable industry insights. Since assuming the role of Chief Executive Officer of InfoLink Consulting on January 1, 2026, she has continued to advance the company’s research-driven strategy and advisory capabilities.
*InfoLink strives for information comprehensiveness, but manufacturers’ official data shall prevail in case of any discrepancies with official data. The content of this article is provided solely as a reference for market analysis and trend assessment, and does not constitute any endorsement, evaluation, investment advice, or commercial guarantee regarding any enterprise.
The post Energy storage cell shipment data for H1 2026 reveal three structural shifts appeared first on Energy Storage.